Analyst’s Notebook
integrates with: iBase,
Pattern Tracer TCA,
iBridge,
Crime Workbench.
Analyst’s Notebook
is a graphical software product designed to display and analyze the
intelligence relating to an investigation. It provides a wide range of
methods to support users in the analysis, helping to navigate through large
networks of data, unravel complex relationships and discover underlying
interconnections quickly.
Within the Alert system
Analyst’s Notebook is integrated with
Crime Workbench via
CWB i2 Plug-in, enabling the
visualization of analytical entities and links stored in
CWB databases and providing the users
with the functionality of Crime Workbench
from the Analyst’s Notebook level.
Analyst’s Notebook
provides the optimum environment for effective link and timeline analysis.
It is the de facto standard for this type of analysis worldwide and is an
essential visualization application. It is always instrumental in:
-
identifying the factors contributing to an issue, evaluating their
probable causes and effects and understanding the relationships between
them;
-
increasing the ability of the analytical team to rapidly achieve a
broad-based understanding of complex situations;
-
providing an ideal medium for disseminating critical information
concisely;
-
quick identification of the common elements and connections within your
data;
-
providing a comprehensive range of analytical techniques to develop the
investigation;
-
graphical presentation of the results, making them more accessible and
easier to understand;
-
production of dynamic briefing charts by including photographs, video
clips and documents;
-
providing rapid changes to the representation of your chart from link
analysis to time analysis, and visa versa;
-
dissemination of the information by printing the charts or sending them
electronically to other interested parties.
Analyst’s Notebook
is used to graphically present entities and associations between them in the
form of analytical charts. Entities are selected pieces of analyzed
information, such as persons, companies, addresses, vehicles etc. They can
be presented on a chart with icons or other symbols such as: theme lines,
event frames, boxes, circles, text blocks, OLE objects. Associations are
shown as links between entities. Each entity and each link features a
defined type.
Analyst’s Notebook
chart is not only a picture. There is also a lot of information hidden
behind it. For example, you can gather knowledge on entities or links in the
form of information cards.
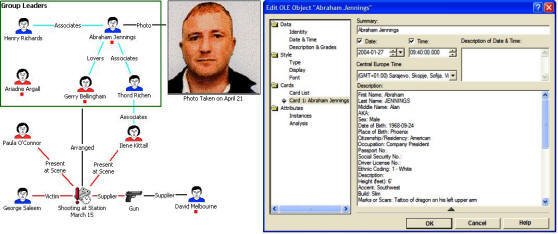
Example of Analyst’s Notebook Char Including Information Card.
With Analyst’s Notebook, you can create
charts, both manually and automatically, using the importing facility. The
information may come from a variety of sources, such as personal knowledge,
written reports, photographs, video clips, spreadsheets, e-mail, word
processing files and databases. Analyst’s
Notebook allows you to display and analyze the information in a
visual form.
Analyst’s Notebook
integrates with all other i2 products, such as
iBase or Pattern Tracer. It can
also be configured to connect direct to your own database systems or to
integrate with other applications.
Analyst’s Notebook
supports link analysis, network analysis, timeline analysis and transaction
pattern analysis.
Link analysis
visually links different entities, such as people and organizations, to show
the relationships between them. This can be used to show flows of
commodities, or help to form better understanding of who the key players
are, their communications, operating methods, and any associated partners.
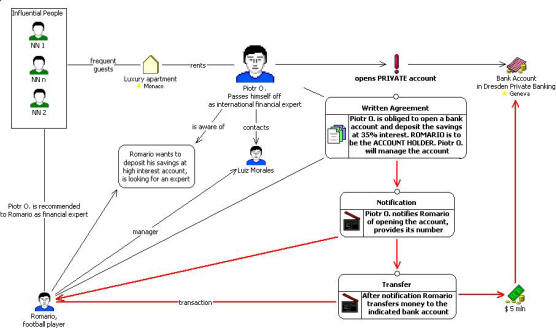
Link Analysis Charts Showing Associations.
Network analysis
applies link analysis to large data sets such as telephone calls, bank
account transactions, and Internet traffic records, to reveal paths,
clusters or connected groups.
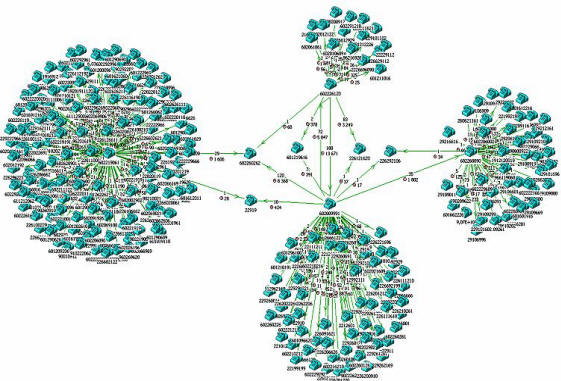
Network Analysis Chart Showing Telephone Traffic.
Timeline analysis
depicts events as they unfold over time, allowing to understand cause and
effect, identify patterns, and decide upon appropriate courses of action.
Entities can be tracked over time, to identify their associations with an
event or incident.
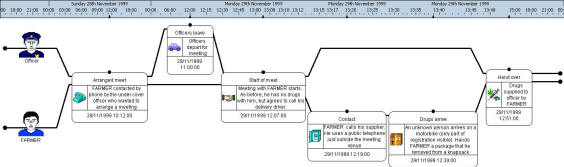
Timeline Analysis Chart Showing How Related Events Unfold over Time.
Transaction pattern analysis
allows to display a series of transactions in chronological order. This
helps to reveal repeating patterns of activity and can help to predict
future behavior.
Transaction Pattern Analysis Chart Showing Financial Transactions.
The four analytical methods just listed are used to produce comprehensive
charts depicting the entire investigation, or charts showing particular
elements that can be used for briefings. Charts can also contain a mixture
of these types of information.
The data in the chart can be viewed from different perspectives. For
example, you may create a chart that shows associations between entities,
such as telephones and telephone calls. You can easily change the focus of
your chart by changing the representation of items on the chart.
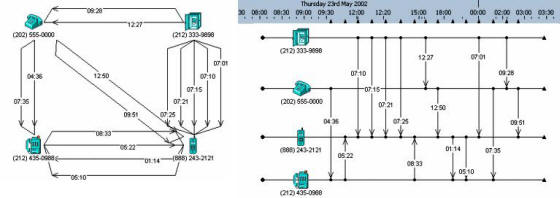
Viewing Same Telephone Calls from Various Perspectives.
Besides visualization, presentation and the database functions accessible
from the Analyst’s Notebook level, the
application provides a number of powerful analytical functions such as
Visual Search, Find Text, Find Path, Find Clusters,
Find Matching Entities, Importing or Reporting.
)
)
)
)
)
)